Q2 Review
U.S. equities hit new highs in Q2, but the path was anything but smooth. Let’s look at how Intech ETFs stayed positioned through the volatility and concentration.
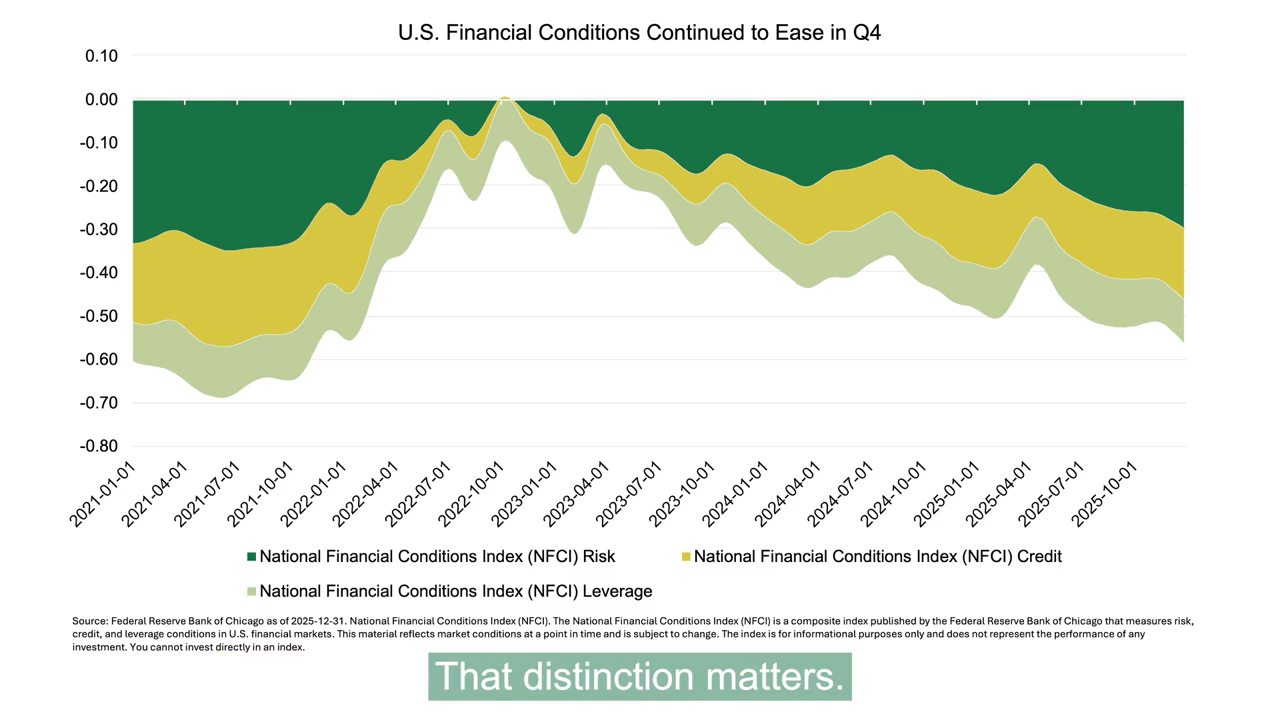
In Q2, large-cap stocks surged, powered by tech momentum, while small caps and defensives lagged. Tariff shocks and geopolitical unrest introduced early volatility, but by June, broad equity markets hit all-time highs.
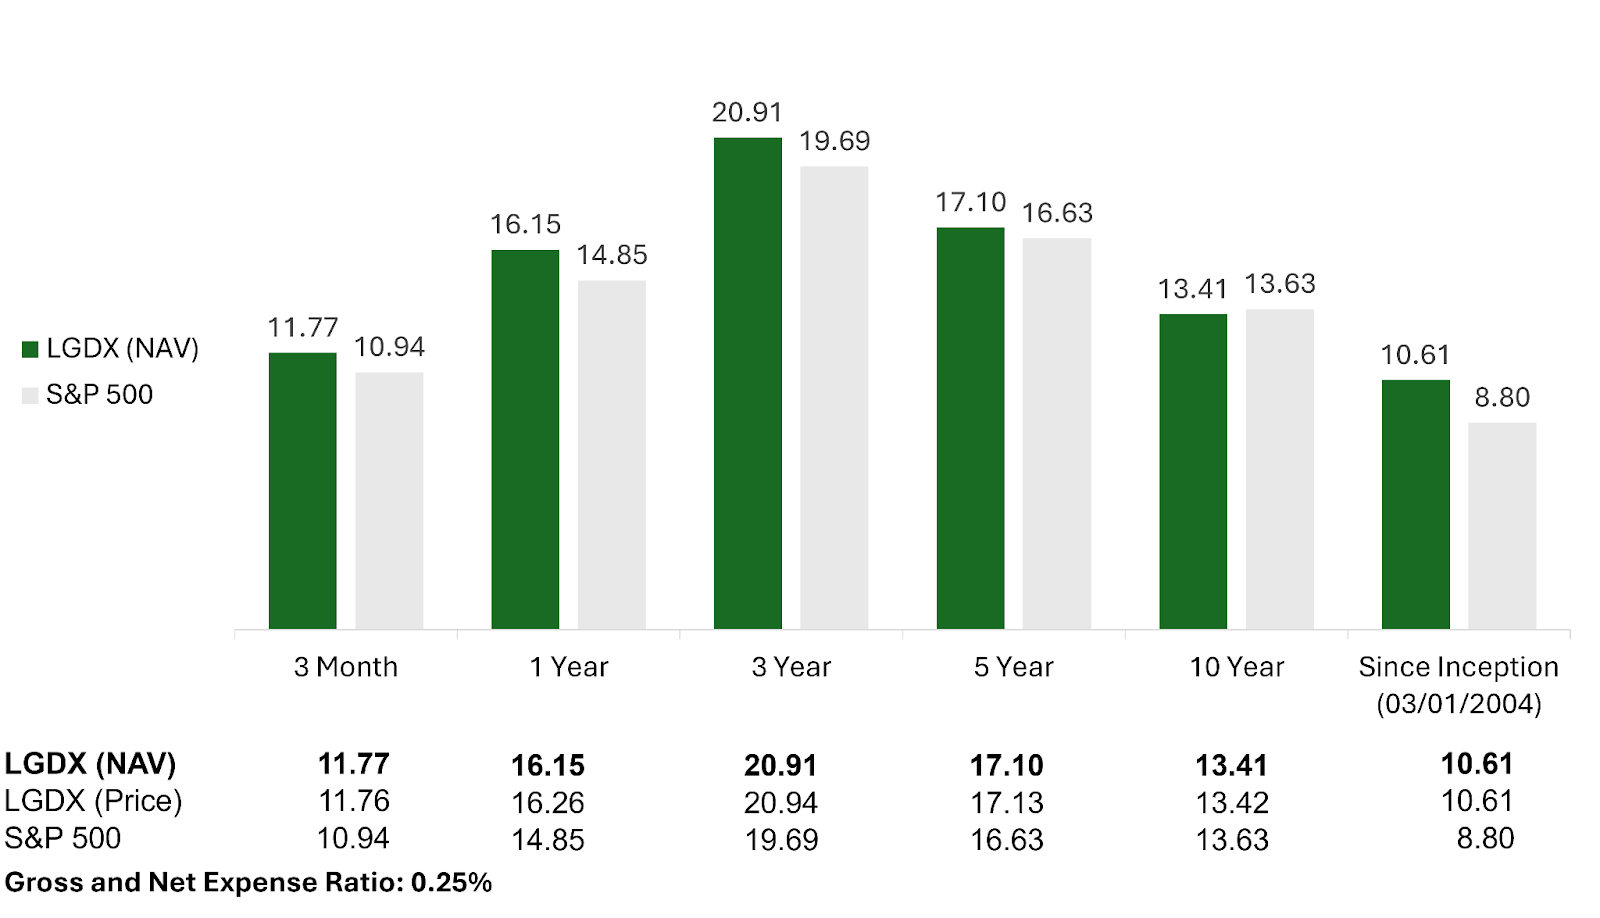
LGDX, our large-cap ETF, continued the 21-year legacy of its predecessor fund and outpaced the S&P 500 in Q2.
Since it’s inception in 2004, the strategy has compounded through market cycles. 5- and 10-year results demonstrate consistency across regimes. And its 1- and 3-year returns reflect strength in recent conditions (Figure 1).
The fund’s recent ETF conversion continues this record with the same investment team and process—now in a more efficient investment vehicle.
Figure 1: LGDX vs. S&P 500
The performance data shown represents past performance and does not guarantee future results. Current performance may be higher or lower than the performance shown. The investment return and principal value of an investment will fluctuate so that an investor’s shares, when redeemed, may be worth more or less than their original cost. To obtain the most recent month-end performance data, visit www.intechetfs.com.
Performance includes reinvestment of dividends and other earnings. Returns for periods shorter than one year are not annualized. For ETFs, the market price return is calculated from closing prices as determined by the fund’s listing exchange. If you trade your shares at another time, your return may differ.
Performance prior to 02/27/2025 reflects the results of the predecessor fund, a private investment fund structured as a commingled vehicle under Section 3(c)(7) of the Investment Company Act of 1940. The predecessor fund was managed using the same strategy and objectives as the ETF but was not subject to the same regulatory, fee, or expense structure, which may have affected results. Net asset values (NAVs) of the predecessor fund were used for both NAV and market price performance from inception to listing. Performance reflects the deduction of applicable predecessor fund fees and expenses. For periods after 02/27/2025, ETF performance reflects the deduction of all applicable fund expenses, including management fees, trading costs, and other operating expenses.
Source: Intech as of 06/30/2025
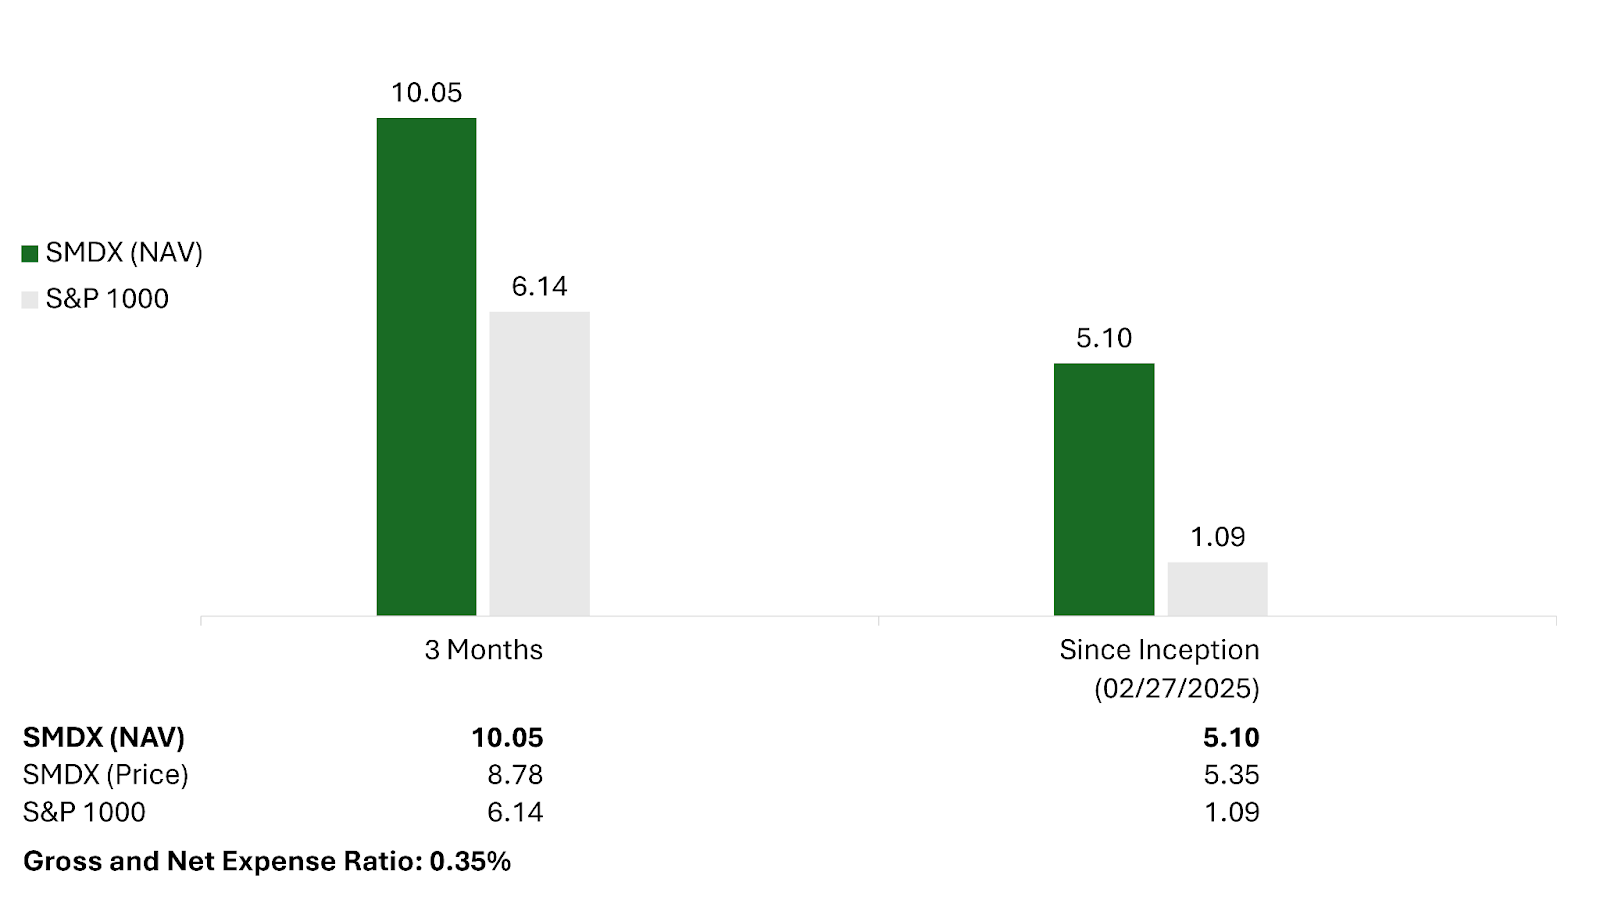
Now, let’s turn to SMDX—our SMID cap ETF launched in February of this year. Using the same investment process as LGDX, but applied to the S&P 1000, it, too, outperformed its benchmark in Q2 and since inception. While still early, SMDX is off to a strong start—delivering diversified exposure to small- and mid-cap stocks while systematically managing risk.
Together, LGDX and SMDX—just two ETFs—are designed to offer investors complete U.S. core equity exposure.
Figure 2: SGDX vs. S&P 1000
The performance data shown represents past performance and does not guarantee future results. Current performance may be higher or lower than the performance shown. The investment return and principal value of an investment will fluctuate so that an investor’s shares, when redeemed, may be worth more or less than their original cost. To obtain the most recent month-end performance data, visit www.intechetfs.com.
Performance includes reinvestment of dividends and other earnings. Returns for periods shorter than one year are not annualized. For ETFs, the market price return is calculated from closing prices as determined by the fund’s listing exchange. If you trade your shares at another time, your return may differ.
Source: Intech as of 06/30/2025
Current Environment
Today’s market may appear calm on the surface, but underneath, dispersion is rising. That means a wider spread between stock winners and laggards, especially in the S&P 500®. You can see this clearly in the chart, which tracks the growing gap between index constituents’ 25th and 75th percentile returns (Figure 3).
That’s where our process thrives: buying quality companies below their diversification-driven targets, trimming overweighted names, systematically turning volatility into opportunity.
Our ETFs adjusted active weights in response, leaning into volatility signals and stock-specific opportunities. For LGDX, that included participating in gains in high-momentum names like NVIDIA and Meta, while maintaining broad, diversified exposure.”
Our approach favors consistency over concentration, helping investors stay exposed to leadership without depending on it.
Figure 3: S&P Stocks’ Interquartile Return Spread is Rising
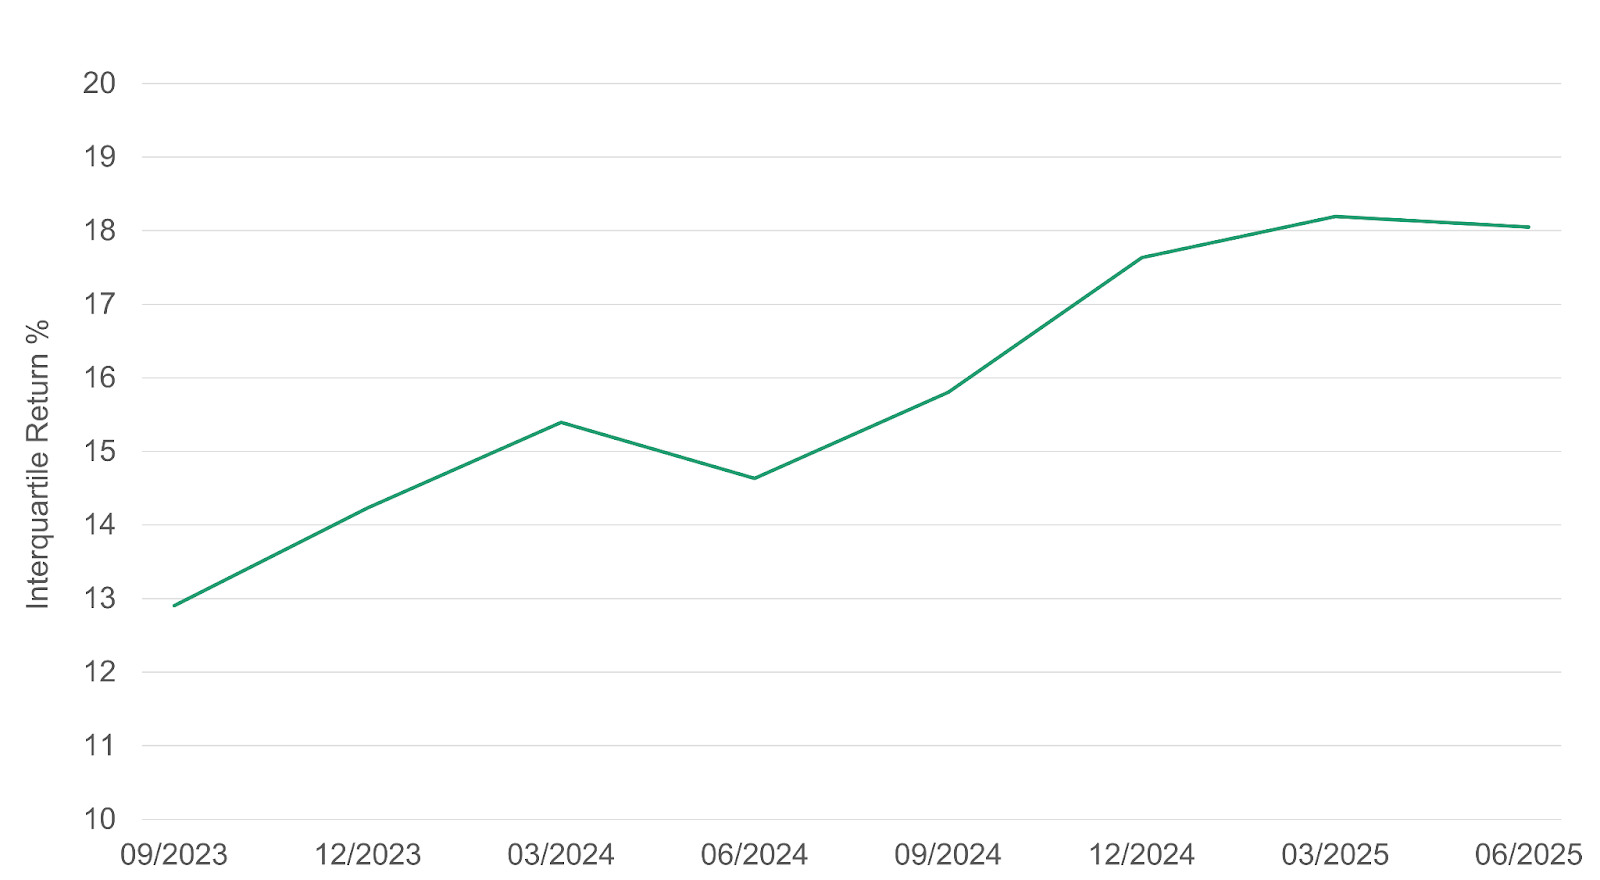
Source: FactSet as of 06/30/2025 and Intech analysis off S&P 500® index constituent returns. Chart reflects the interquartile range (spread between 25th and 75th percentile trailing returns) over time and is provided for illustrative purposes only. The data does not represent actual or hypothetical performance of any Intech ETF. Past performance or market characteristics do not guarantee future results.
Looking Ahead
As we head into Q3, investors face mixed signals: moderating inflation, evolving Fed policy, and growing legislative uncertainty. The recent rally reflects optimism—but volatility could return quickly.
One risk remains persistent: concentration. Today, the top 10 names still make up a third of the S&P 500—and many of them move in tandem (Figure 4). Reducing tech exposure isn’t enough. What matters is managing the relationships between individual stocks that shape overall portfolio risk.
Figure 4: Capitalization Share of the Largest 10 Stocks in the S&P 500 Index
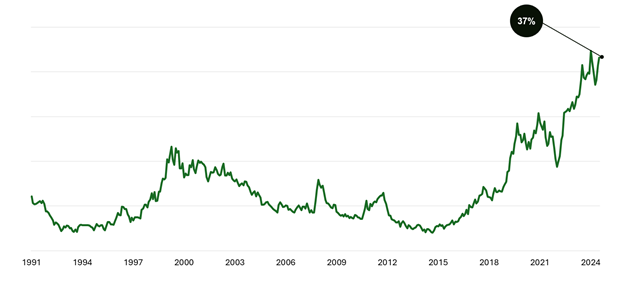
Source: FactSet as of 06/30/2025. General Disclaimer: Charts and data are for illustrative purposes only and do not represent actual performance of any Intech ETF. Past performance is not indicative of future results. Investments are subject to risk, including loss of principal. Challenge #1: Source data reflects the capitalization share of the 10 largest stocks within the S&P 500® Index as of the dates shown. Index performance is not directly representative of Intech ETF strategies.
That’s where Intech’s investment process comes in. We use volatility and correlation data to improve how risk and return are distributed—enhancing diversification while staying closely aligned with the benchmark.
This systematic approach continuously refreshes portfolio balance—preserving fit and offering a distinctive return source that complements both indexing strategies and conventional active approaches.
The result is core equity exposure that evolves with the market—in Q2, Q3, and beyond.
With LGDX and SMDX, investors gain access to a more resilient core. It’s passive simplicity—engineered to deliver more.