Most investment strategies answer a simple question:
What should we own?
Fewer ask a harder one:
How should we hold it together?
In core equity, that second question often determines how risk behaves through time. Inclusion defines exposure. Interaction defines outcomes.
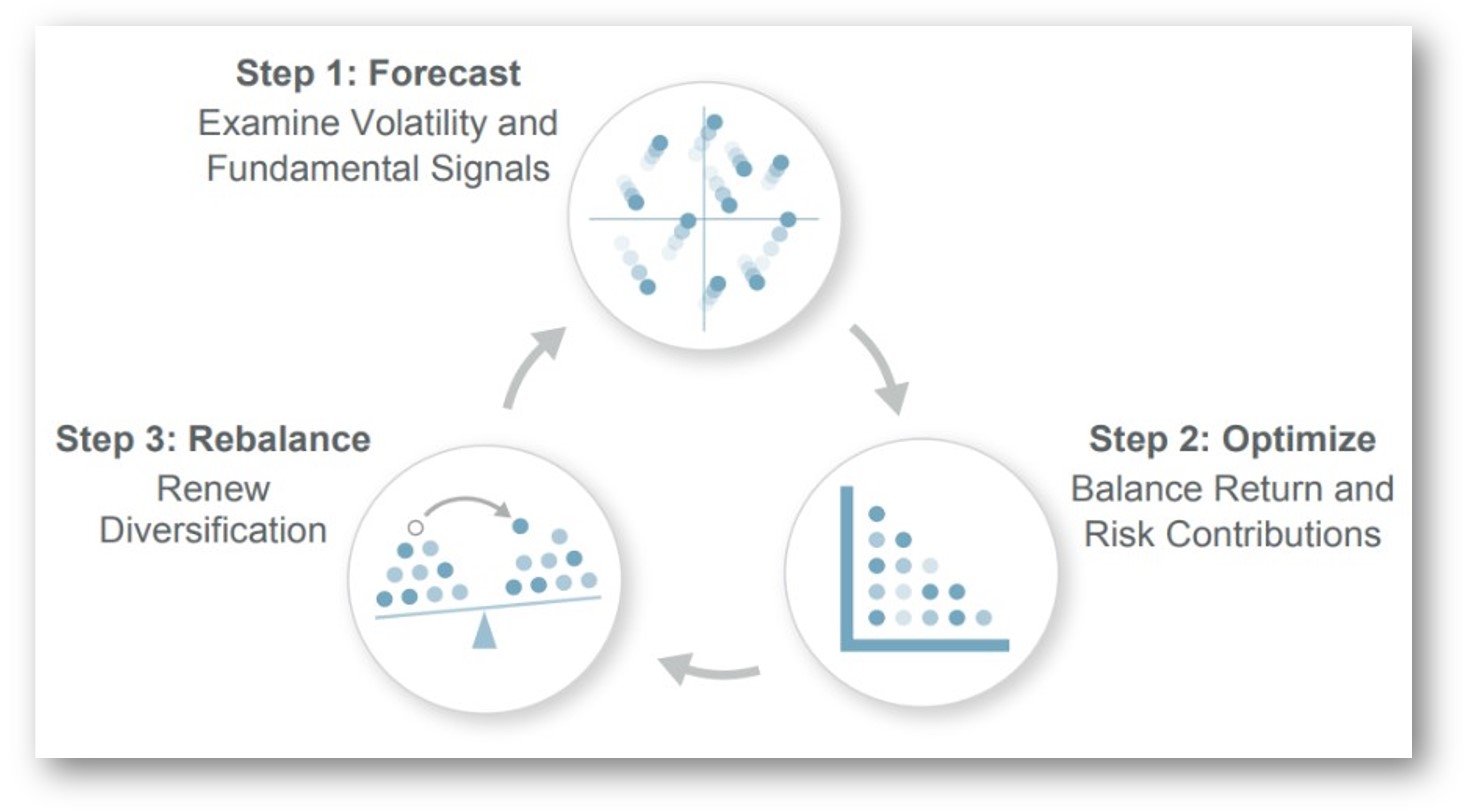
Intech’s investment framework is built around that distinction. It begins at the benchmark and applies a three-step, systematic process designed to integrate fundamentals with portfolio structure while operating inside explicit risk guardrails
This is not a tactical overlay.
It is portfolio engineering.
Step 1: Forecast — Two Complementary Alpha Engines
The process begins inside the benchmark universe. The objective is not to replace beta, but to work within it.
Intech evaluates each stock through two complementary lenses:
Stock-Effects Model
These signals assess company-level attributes associated with differentiated return potential. They include measures related to:
- Valuation
- Financial strength
- Momentum
- Sentiment and positioning
- Technical and microstructure measures
Signals are evaluated relative to appropriate peer groups to reduce distortion from outliers and align turnover with intended investment horizons.
The focus is fundamental durability, not thematic storytelling.
Volatility-Effects Model
The second lens evaluates how each stock’s price behavior interacts with others in the portfolio.
These measures assess:
- Realized volatility patterns
- Cross-sectional dispersion
- Correlation characteristics
- Volatility asymmetry
- Implied versus realized volatility dynamics
The purpose is not to select “low volatility” stocks. It is to understand how a stock contributes to portfolio-level interaction and potential excess growth.
Together, these two engines recognize that long-term portfolio growth reflects both business fundamentals and portfolio structure.
Most strategies emphasize the first.
This framework integrates both.
Risk Budgeting: Integrating the Signals
Once stock and volatility signals are estimated, the next challenge is integration.
Alpha models can overwhelm one another if left unconstrained. A valuation signal may dominate momentum. A volatility signal may distort sector exposure.
To prevent that, the framework applies a risk-budgeting discipline.
Each signal family contributes to active risk in a measured way. No single characteristic is allowed to dictate portfolio construction.
This ensures:
- Balanced exposure across signal families
- Reduced reliance on any single factor cycle
- Transparency in how active risk is deployed
The result is not a factor bet.
It is a structured allocation of active risk across complementary dimensions.
Step 2: Optimize — Engineering Structure Within Constraints
Once signals are estimated, the optimizer translates them into portfolio weights.
The objective is to strengthen diversification and growth potential while keeping the portfolio recognizably benchmark-like.
Optimization operates within explicit constraints, including:
- Benchmark alignment
- Sector and industry tolerance bands
- Position-size limits
- Liquidity thresholds
- Turnover considerations
- A defined tracking-error range
These constraints matter.
They anchor the portfolio to its policy role as core equity exposure. They help ensure that relative outcomes are driven by portfolio structure and signal integration, seeking to avoid unintended macro tilts or concentrated bets.
These guardrails are intended to maintain benchmark familiarity while distributing risk more evenly across holdings
Modest Tracking Error: Staying Recognizably Core
In core equity, familiarity matters.
A strategy that drifts too far from its benchmark may introduce governance friction regardless of theoretical appeal.
That is why tracking error is managed deliberately.
The process is engineered to operate within a modest tracking-error range, consistent with benchmark-aligned core equity.
Beta is managed to remain near 1.0.
Sector exposures are monitored.
Factor exposures are observed to avoid unintended tilts.
The objective is not to look different. The strategy is designed to behave differently while remaining recognizably core.
Step 3: Rebalance — Discipline Over Drift
Optimization establishes structure. Rebalancing is designed to preserve it.
As markets move, prices change. Weights drift. Concentration builds mechanically.
The framework uses predefined tolerance bands around target weights:
- Positions inside bands are left untouched.
- Positions breaching bands are adjusted.
This approach concentrates trading where dispersion is meaningful and where the expected structural benefit justifies cost.
Stochastic Portfolio Theory posits that when individual stocks follow different paths—even with similar average returns—a portfolio that systematically trims relative winners and adds to relative laggards have the potential to achieve higher compound growth than a static allocation, subject to costs and constraints.
The effectiveness of this discipline is environment dependent. Favorable conditions may include broad dispersion and rotating leadership, while narrow and persistent leadership may limit opportunities.
Operational Integrity: Designed for Scale
Portfolio engineering must survive real-world constraints.
The framework incorporates:
- Liquidity minimums
- Participation-based trade limits
- Capacity monitoring guidelines
- Explicit position caps
Turnover is driven primarily by systematic rebalancing and signal evolution, not discretionary trading.
From Inclusion to Interaction
The effectiveness of this discipline is environment dependent. Favorable conditions may include broad dispersion and rotating leadership, while narrow and persistent leadership may limit opportunities.
It is a systematic, documented way to take core equity risk: one that recognizes portfolio structure as a contributor to long-term outcomes.
Engineering diversification is not about abandoning beta.
It is about governing how beta is expressed.
Validate the Framework
Explore the full investment architecture, including signal design, optimization mechanics, and risk parameters.
Explore the Process → Intech | The Architecture of Diversified Alpha