I recently joined Sam Vadas on Schwab Network’s Trading 360 to discuss earnings, AI, and market dynamics. One theme came through loud and clear: today’s markets are reacting more to positioning and sentiment than to fundamentals.
That might sound unsettling to some investors. But to me, it highlights a deeper opportunity. If we want to make sense of this moment and what it means for portfolio construction, we need to stop focusing only on the results and start paying closer attention to the reactions.
Because in many cases, reactions tell you more.
1999 Paradox- Overvalued Companies, Undervalued Internet
When Price Action Outruns the Fundamentals
This earnings season has been solid. Over 80% of S&P 500 companies beat expectations. Big tech delivered again. But it was the lower-quality, low-profit names that stole the spotlight in July—many of them rallied on retail volume, not on strong earnings.
So the question becomes: why?
Why are these companies moving the most?
It’s not just about revenue beats or misses. It’s about how narratives get priced, how sentiment flows through trading, and how investors respond, especially when macro and micro stories don’t align. These dislocations don’t scare me. In fact, they’re part of the reason I believe volatility, when understood correctly, may offer one of the most useful signals we have.
Concentration Isn’t the Problem—Complacency Is
There’s been no shortage of concern about the S&P 500’s concentration. And I get it—mega-cap tech names have become a larger share of the index than ever before. But let’s be honest: this didn’t happen by accident. It’s a function of innovation.
The companies at the top have reinvested aggressively in infrastructure, AI, cloud, and distribution. That’s not market distortion—it’s market evolution.
During the interview, I compared this moment to the early internet era:
“Every internet company could have been overvalued in 1999—but the internet itself was undervalued.”
I think we’re in a similar position today with AI. That doesn’t mean every AI company will win. It does mean that innovation cycles create dispersion—and with the right process, that dispersion is investable.
How is the Tech Sector Doing?
Volatility Isn’t the Enemy. It’s Raw Material.
On the surface, volatility seems low. The VIX (a measure of expected volatility in the S&P 500, often called the market’s “fear gauge”) has hovered around 14 for much of the summer. But under the hood, I’ve seen a very different story.
- Risky, low-margin stocks surged in July.
- Sentiment-driven trades—crypto, meme names—outperformed durable businesses.
- Meanwhile, correlations and leadership shifted quickly.
At Intech, we don’t dismiss those moves as noise. We model them. We interpret volatility structurally, not emotionally. That allows us to treat volatility as a design input, not just something to hedge or fear.
We’ve managed through cycles like this since 1987. We know that volatility clusters, leadership rotates, and sentiment overshoots. But with a systematic process that continually refreshes diversification, we can stay adaptive without relying on prediction.
AI, Capex, and the Next Phase of Market Structure
The market’s obsession with AI is understandable. Investors are asking big questions:
How big can this get? How much of the economy will be restructured? Where does the spending stop?
I don’t pretend to know the exact endpoint. But I do believe we’re in a phase where the upside from AI is real—even if some company valuations are stretched. It’s not unlike the early days of cloud computing: unclear winners, but undeniable momentum.
So what do we do with that?
For me, the answer is to find participation without dependence.
AI Arms Race
I want to create portfolios that are exposed to transformational trends but don’t require us to pick the winner.
That’s what our strategies are designed to do—diversify exposure, refresh it as leadership changes, and maintain alignment with broad benchmarks like the S&P.
Diversification Still Works—Just Not the Way It Used To
A lot of investors have given up on diversification. They assume it doesn’t work because the largest names keep winning. But I think that misses the point.
Diversification today isn’t about owning 500 stocks equally. It’s about understanding the structure of risk and building portfolios that can thrive as markets shift.
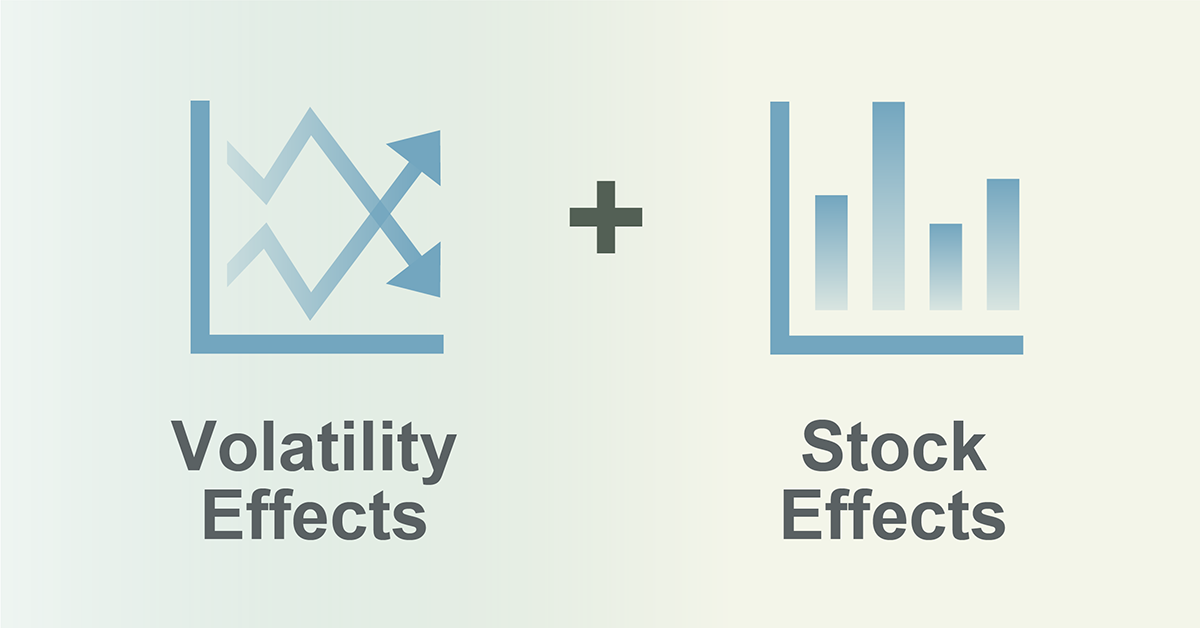
At Intech, we weight portfolios based on:
- Stock price volatility
- Stock-level correlations
- Persistent fundamentals
We don’t need to predict the next NVIDIA. But we do want a process that benefits when dispersion widens and innovation drives volatility.
Final Thought: Design Matters More Than Big Bets
In this kind of market—where earnings are strong but reactions dominate, where AI hype meets real transformation—what investors need isn’t conviction in a stock. It’s conviction in a process.
That’s the message I tried to convey on the Schwab Network. And it’s the reason our ETFs exist: to give investors a systematic way to navigate volatility, seeking to capture alpha from the portfolio’s structure, and participate in innovation cycles without chasing headlines.
We’re not here to tell the market what should happen. We’re here to build portfolios that respond intelligently to what does happen.
If this resonates, follow Intech ETFs or connect with me here on LinkedIn for more insights.
Thanks for reading—and thanks again to Sam Vadas and the Schwab Network team for the great discussion.