For many advisors, the middle ground between passive indexing and high-conviction active has been factor investing. Tilt toward value, quality, or profitability, and the story goes, clients get systematic exposure to traits that have historically driven outperformance.
But factors come with their own fragility. They rise and fall in long cycles, crowd investors into the same trades, and sometimes redefine themselves in ways that make portfolios behave unpredictably. The result? What looks like diversification on paper can turn into concentration in practice.
Peregrine Asset Advisers recognized this limitation early. Instead of building portfolios around style tilts that may or may not hold up, they turned to a structure-driven approach based on Stochastic Portfolio Theory—one designed to capture not just what stocks bring individually, but how they interact together.
For fiduciary advisors, the lesson isn’t to abandon factors, but to recognize their limits. Factors can add value, but they tell only part of the story. A more complete approach blends stock characteristics with portfolio structure, ensuring diversification is preserved and rebalanced as markets evolve.
The Hidden Costs of Factor Reliance
Factor strategies often promise the discipline of rules-based investing without the unpredictability of active stock picking. But beneath the surface, they carry risks that can undermine their appeal as a true middle ground:
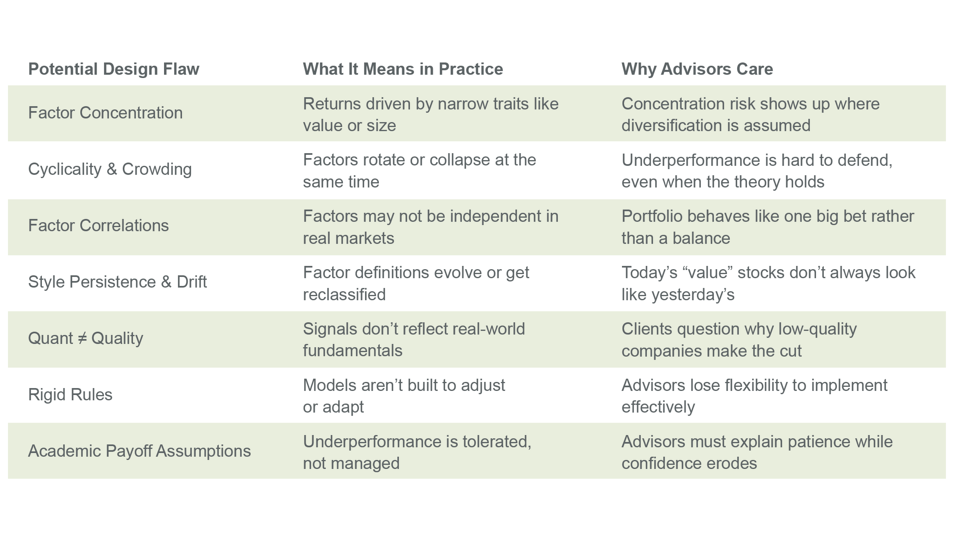
On paper, factor tilts can look like balanced, data-driven solutions. In practice, they can leave portfolios behaving like one big bet—difficult to defend in client conversations and less adaptable to shifting markets.
Peregrine’s experience reflects this reality. For more than a decade, the firm has implemented an approach designed to avoid factor dependence by focusing on portfolio structure itself—using volatility, correlations, and fundamentals to maintain balance over time.
A More Complete Approach
Rather than relying solely on factor tilts, Peregrine turned to a process grounded in Stochastic Portfolio Theory (SPT). SPT recognizes a simple but overlooked truth: portfolio returns don’t just come from the stocks you own—they also come from how those stocks interact.
By focusing on portfolio structure, Peregrine adopted a strategy that:
- Enhances diversification at the index level. Stocks are weighted to balance risk contributions, rather than allowing cap weight or factor definitions to dominate.
- Uses volatility as information. Instead of treating price fluctuations as noise, the process systematically rebalances to capture trading profits from dispersion.
- Preserves benchmark alignment. Broad exposure to the market is maintained, ensuring the strategy fits naturally within policy portfolios.
This dual engine—stock effects + volatility effects—creates what Peregrine sees as a more complete model of portfolio growth. It doesn’t abandon factors, but it goes beyond them, integrating structure to help portfolios hold up as markets evolve.
Conclusion
Factors gave advisors a middle ground when the barbell of passive and active felt stretched. But as Peregrine’s experience shows, factor tilts alone don’t solve the portfolio construction challenge. They rotate, they crowd, and they drift—leaving advisors with exposures that can be difficult to defend in client conversations.
That’s why Peregrine selected a different approach. By allocating to an Intech strategy grounded in portfolio structure, they were able to align with benchmarks while addressing the concentration and conviction risks that traditional core options can magnify.
For advisors more broadly, the takeaway is clear: factors can play a role, but portfolio structure belongs at the center.
Download the full Peregrine case study to see how one RIA strengthened its core allocation by moving beyond factors.